Executive summary
A fragmented status model became one operational readiness picture.
ChargeOps is an EV fleet-charging management platform. This case study covers a mobile-first depot workflow built for a national transit operator electrifying its bus fleet, alongside the desktop console and reporting it shares a model with.
Charger and vehicle data already existed, but every screen exposed it as raw technical status. Operators had to translate ‘connected’ or ‘charging’ into an operational answer themselves, under time pressure, on a moving yard.
The response reframes each status into what it means operationally—readiness, risk or action—and carries that model across mobile and desktop. The client and product names here are placeholders; the screens, decisions and prototypes are the real, unmodified work.
01 · Problem and audience
Technical status wasn’t answering the operational question.
Charging status existed everywhere—connected, charging, faulted—but none of it told a depot manager whether a bus would leave on time. Reservation planning was rigid, while the yard itself changed constantly: late arrivals, faults, doubled-up chargers.
Field operators needed to find a specific vehicle or charger by its real number, instantly, while walking the yard. Faults were reported over chat and email with no audit trail—and the data itself was outgrowing tables never built to scale.
02 · Product model
Four principles turn a status feed into an action feed.
Connected isn’t charging
Read status by what it means operationally, not by what the charger reports.
Time and SoC lead
Remaining time and battery state matter more than any secondary technical field.
Identity must be instant
Charger, connector and vehicle identity are never ambiguous, on any screen.
Uncertainty is part of the product
Loading, empty and fault states are designed, not defaulted.
03 · My role
UX/UI design and AI-assisted prototyping, from reframe to shipped screens.
I worked alongside a second UX designer, a development team, and a project manager who gathered requirements from the client and end users. My own work: framing the problem, reframing the data model, and building AI prototypes to validate direction.
- Frame
Framed the problem
Split one abstract ‘operator’ into three real decision-makers—network, depot and field.
- Reframe
Reframed the model
Turned raw technical status into an operational-readiness interpretation layer.
- Explore
Explored the IA
Tested three competing information architectures across iterative cycles, including A/B variants.
- Prototype
Prototyped with AI
Built interactive Claude Code prototypes from the Figma screens to validate direction with the client and users.
- Scale
Scaled to desktop
Carried the same model into charger monitoring, the side panel and transaction reporting.
- Systemise
Systematized the UI
Assembled a local component layer on Angular Material, shared across every module.
04 · Design process
Iteration reduced ambiguity in the status model—not just polish on the screen.
The work began with a discovery session with the client’s operations team, mapping how depots actually run today and where charging status stopped being useful. That surfaced the need for real-identifier search, operational status, and a shared model across mobile and desktop.
Three competing information architectures were tested—current vs past sessions, charger-first vs vehicle-first, operational vs transactional status—across iterative cycles, including a dedicated A/B round, before converging on one direction.
A DFD session with the client surfaced the real friction: status that didn’t answer the operational question.
Interactive Claude Code prototypes, built from the Figma screens, let the client and users react to real interaction—not a description.
The operational-segment IA won because it matched how depot managers think, not how the system stores status.
05 · Product experience
The interface turns a live operational feed into decisions an operator can act on.
Session tracking
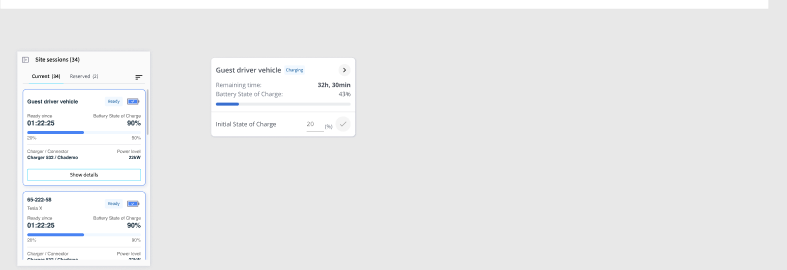
Search by real vehicle or charger number; see status, SoC and time at a glance.
Charger monitoring
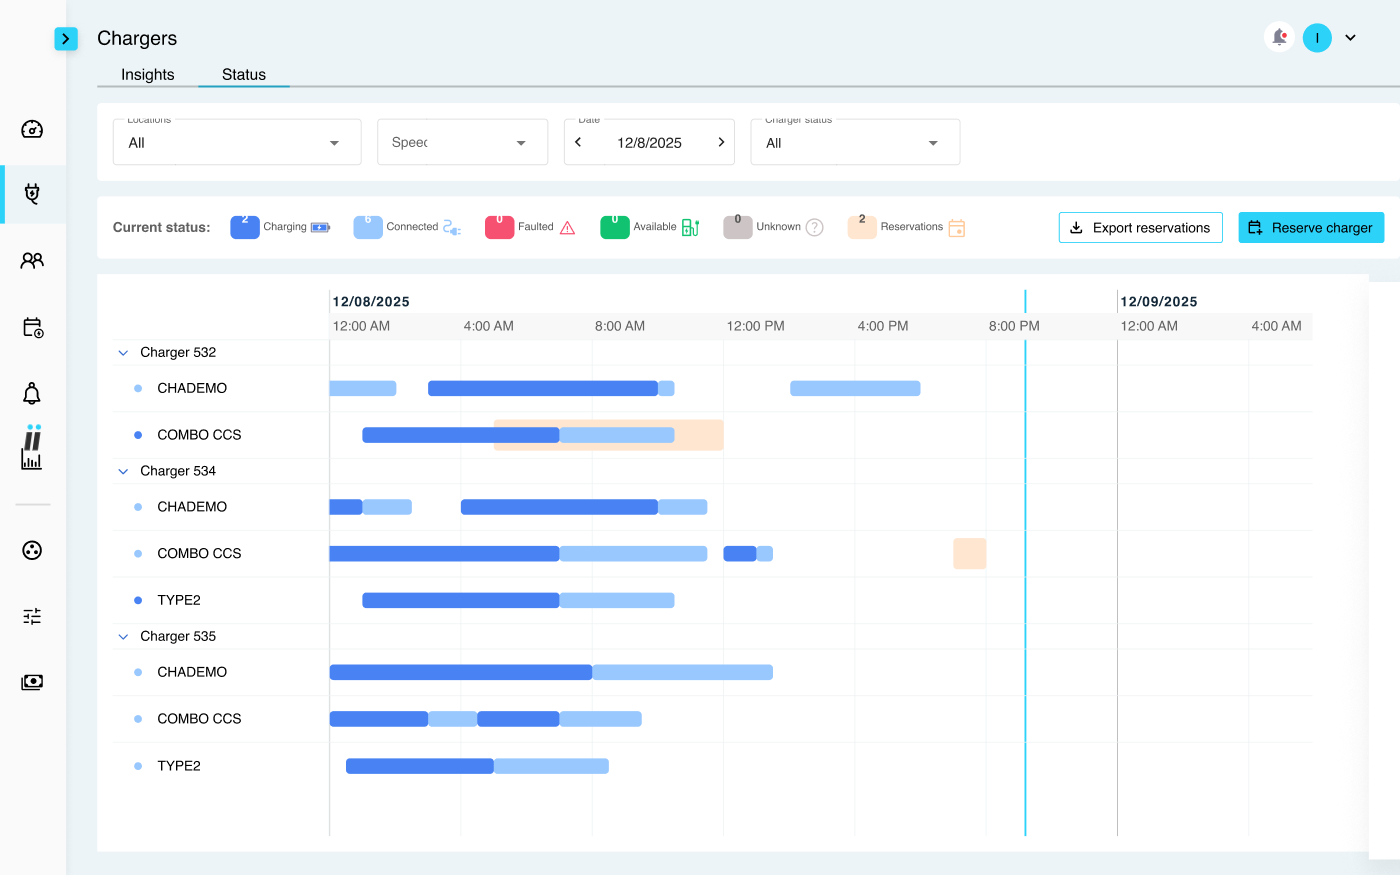
A live per-connector timeline across every charger on site.
Transaction analytics
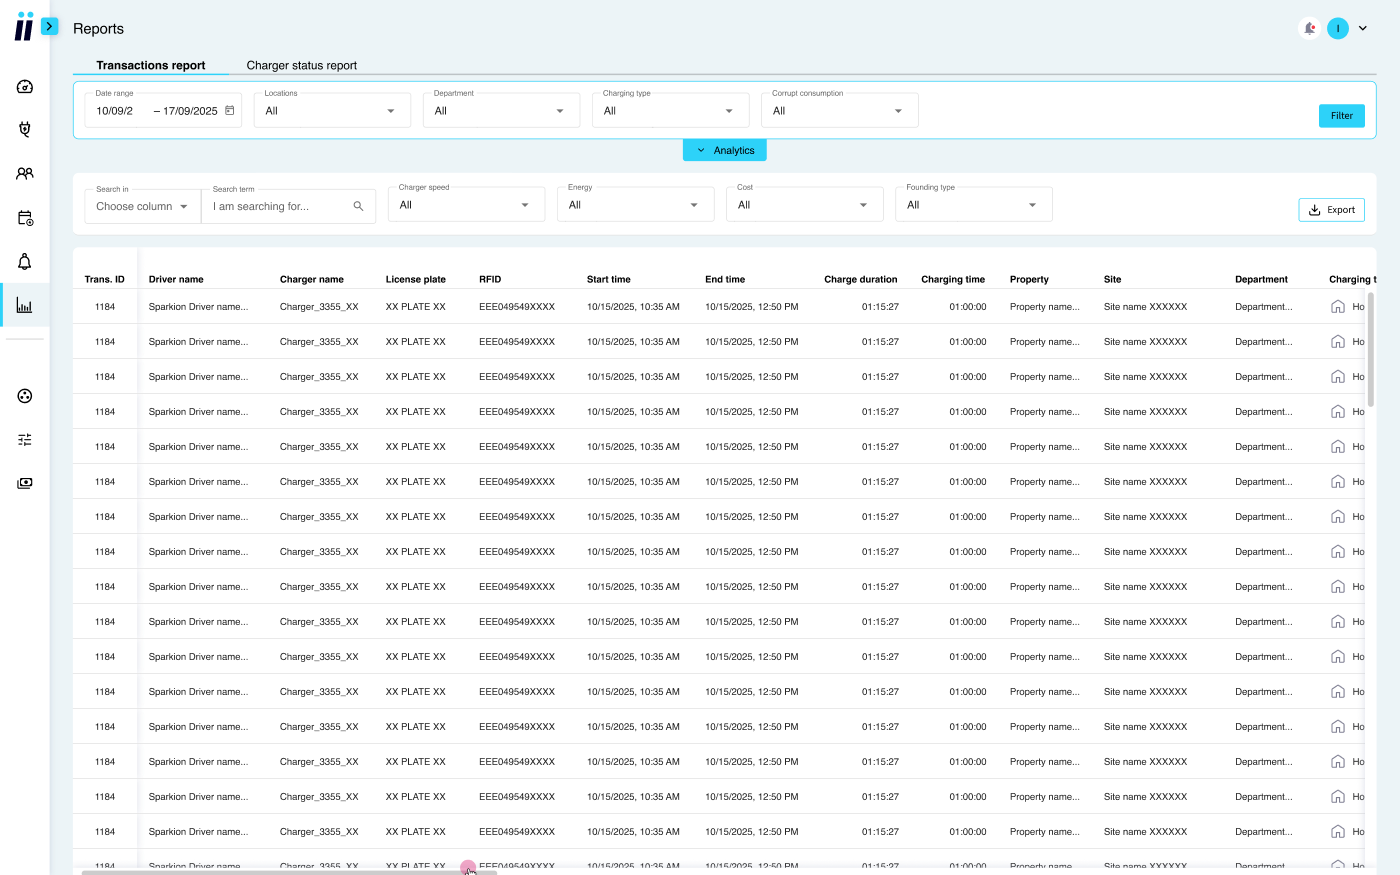
18 configurable columns with an inline analytics panel.
Shared components
One token-bound component layer across mobile and desktop.
06 · Evidence
The design proves the model works; the numbers still need to be measured.
- Scope
Cross-platform model, shipped
One operational vocabulary—readiness, time, SoC, identity—shared by mobile and desktop, not two separate products.
- Coverage
Full flow reached implementation
Mobile session flow, desktop charger monitoring and side panel, and the redesigned transaction report all shipped.
- Impact
Estimated, not yet measured
Faster lookup, faster readiness checks and fewer support escalations are the expected effect of the reframe—real numbers need a post-launch measurement pass.
The design proves the operational model works end to end. Whether it moves the numbers it’s built to move is the next thing to check.
07 · What this demonstrates
A reframe is a design decision, not a copy tweak.
Status is a decision model
Renaming ‘connected’ into ‘ready to act on’ changed every screen that followed it.
Hierarchy is operational
What a field operator sees first is what they’ll act on first—that’s a call about the job, not the layout.
Maturity is in the edges
Loading, empty and fault states carried as much design attention as the happy path.