Executive summary
A marketplace metaphor adapted to the realities of governed enterprise data.
Data Market Point was designed to help employees find, understand and request access to distributed data and analytics assets through one coherent experience.
The interface brings datasets, reports, KPIs, dashboards and business terms into a consistent discovery model while preserving the organization’s authoritative governance and taxonomy structures.
After reaching MVP in three months, the platform was rolled out globally and developed further over a total of 2.5 years. New capabilities were shaped by general, anonymized user feedback.
01 · Problem and audience
Finding data was only half the problem. Understanding whether it was usable came next.
Enterprise data and analytics assets were distributed across different domains, formats and ownership structures. A person could know what they needed and still struggle to find the right asset, interpret its meaning or understand how access worked.
The design challenge was to make discovery feel familiar without disguising governance. Data could be browsed like a marketplace, but access still depended on ownership, justification and review.
02 · Product model
A familiar marketplace loop—with governance kept visible at every step.
Discover
Search across asset classes and narrow the catalog with filters that reflect enterprise language.
Understand
Evaluate definitions, status, ownership, taxonomy and related assets before requesting access.
Request
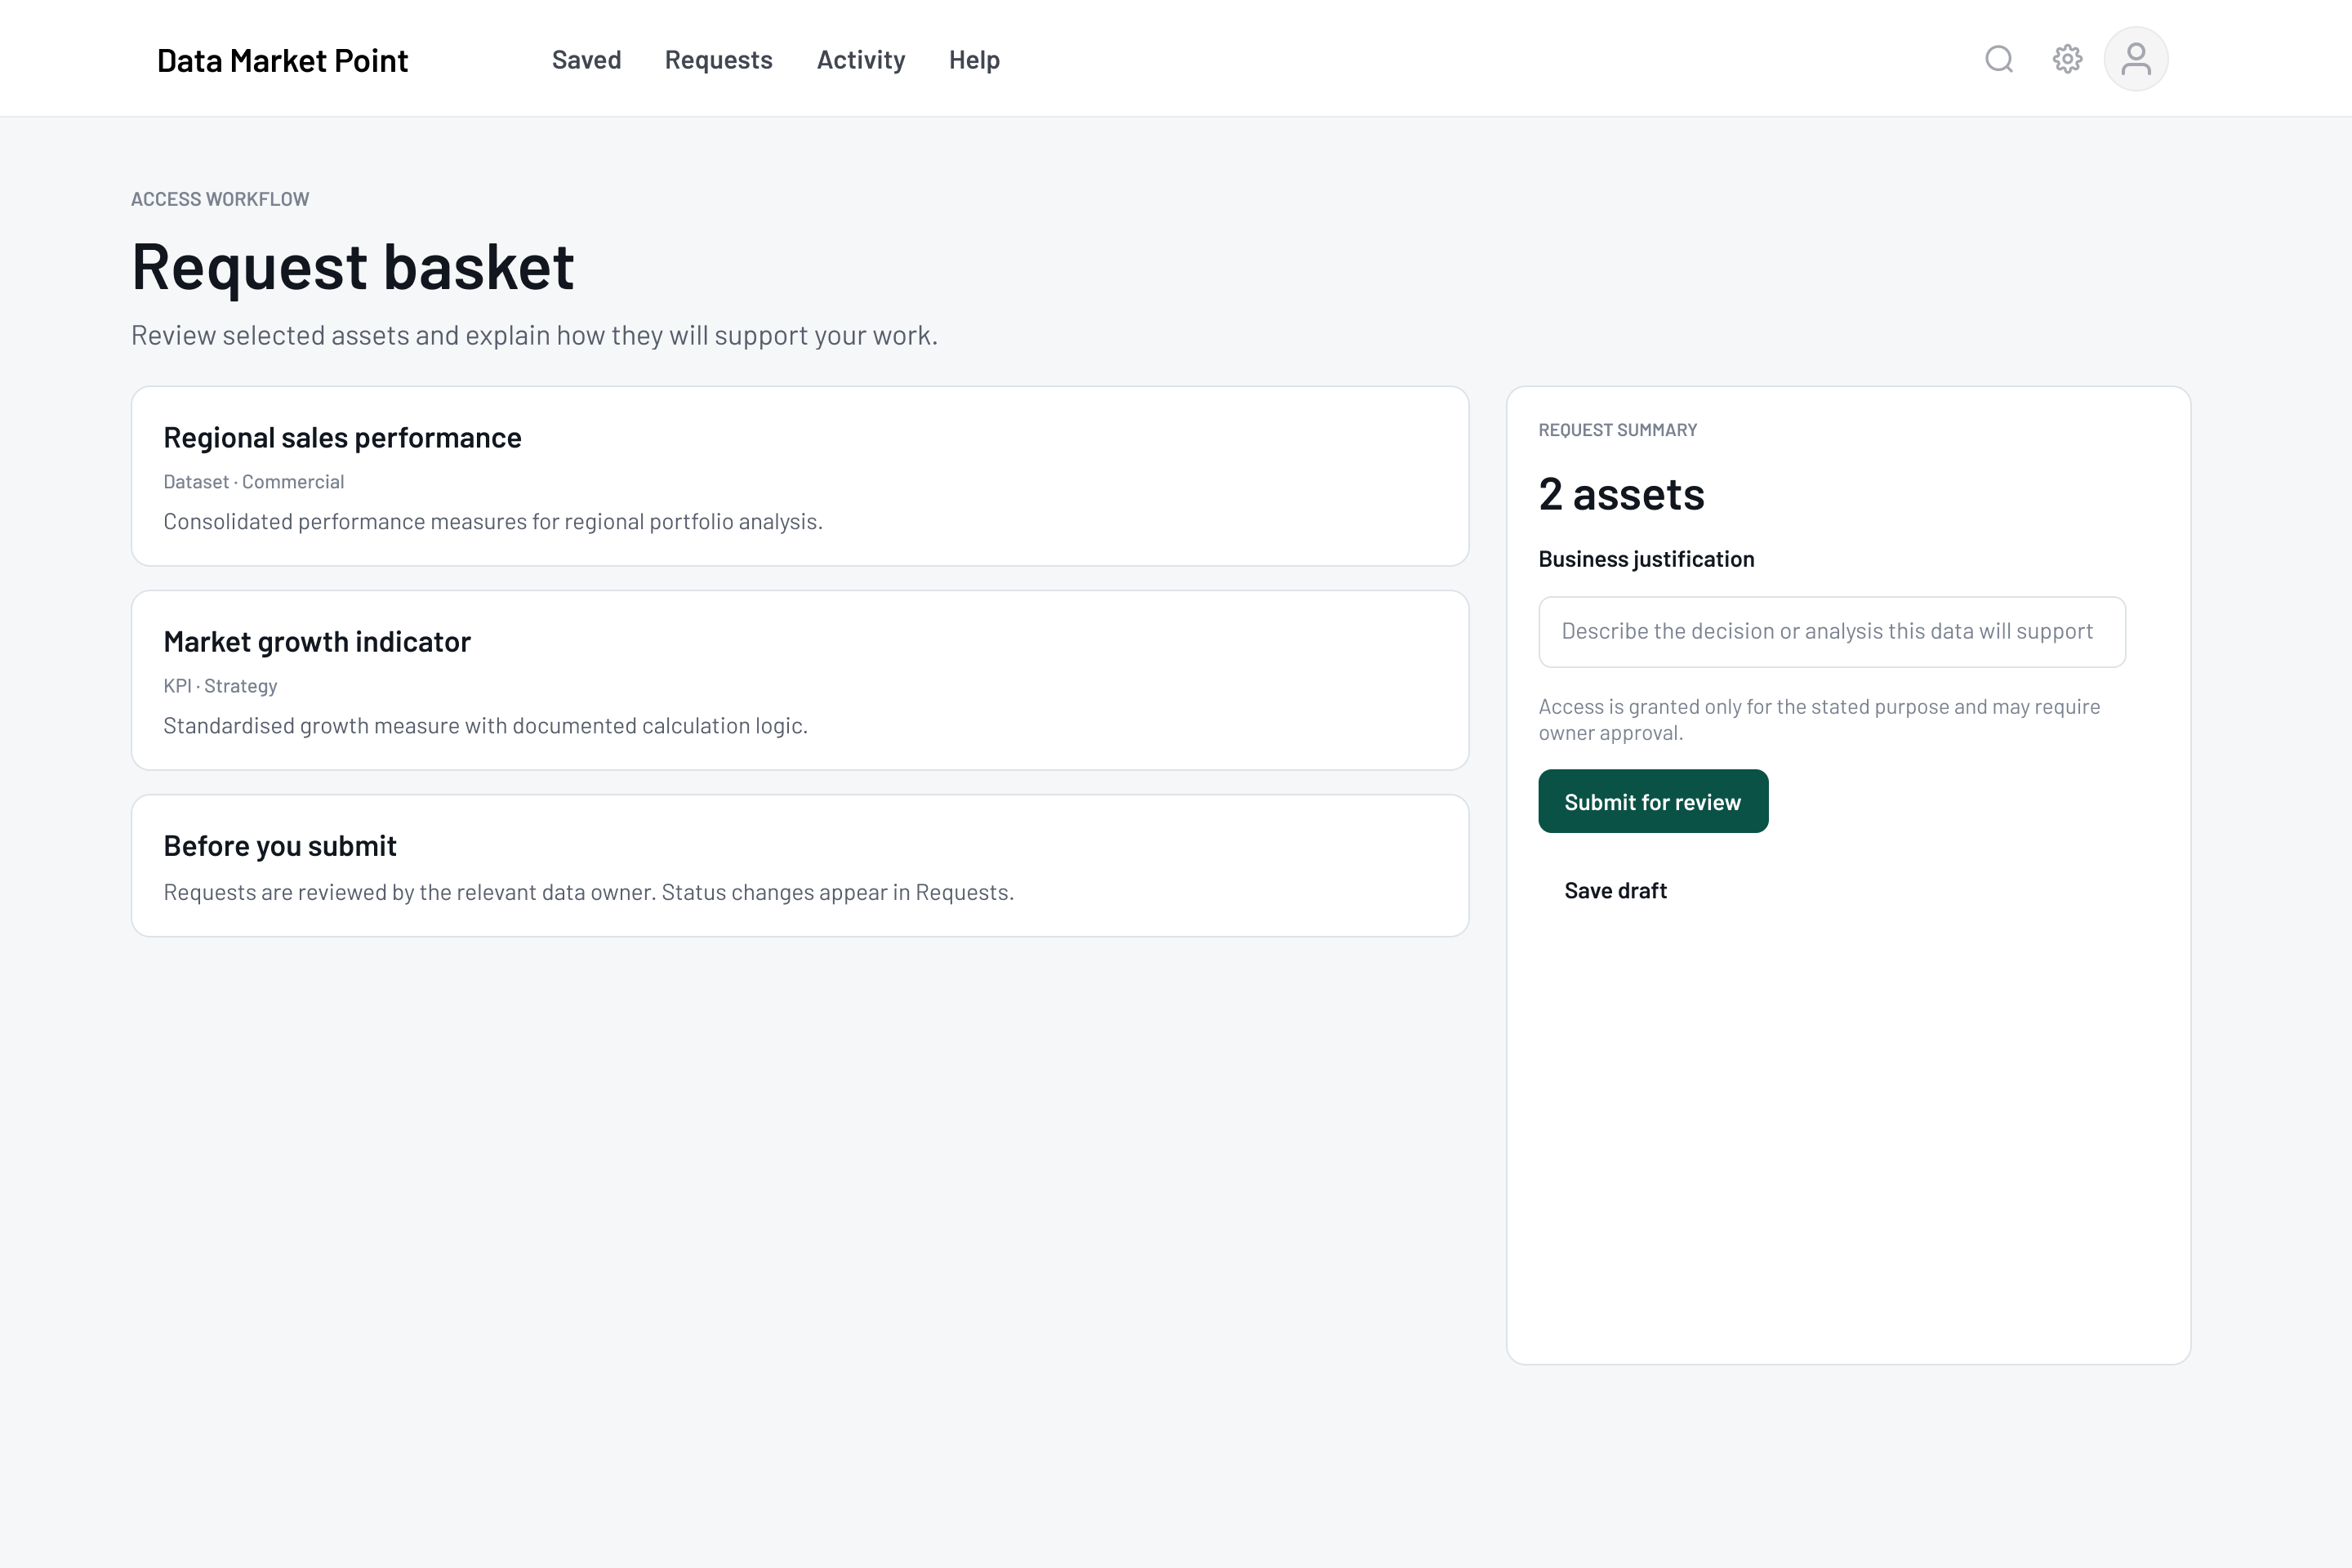
Collect relevant assets in a basket and explain the business need once, in context.
Govern
Keep review and decision-making explicit instead of implying immediate access or purchase.
Track
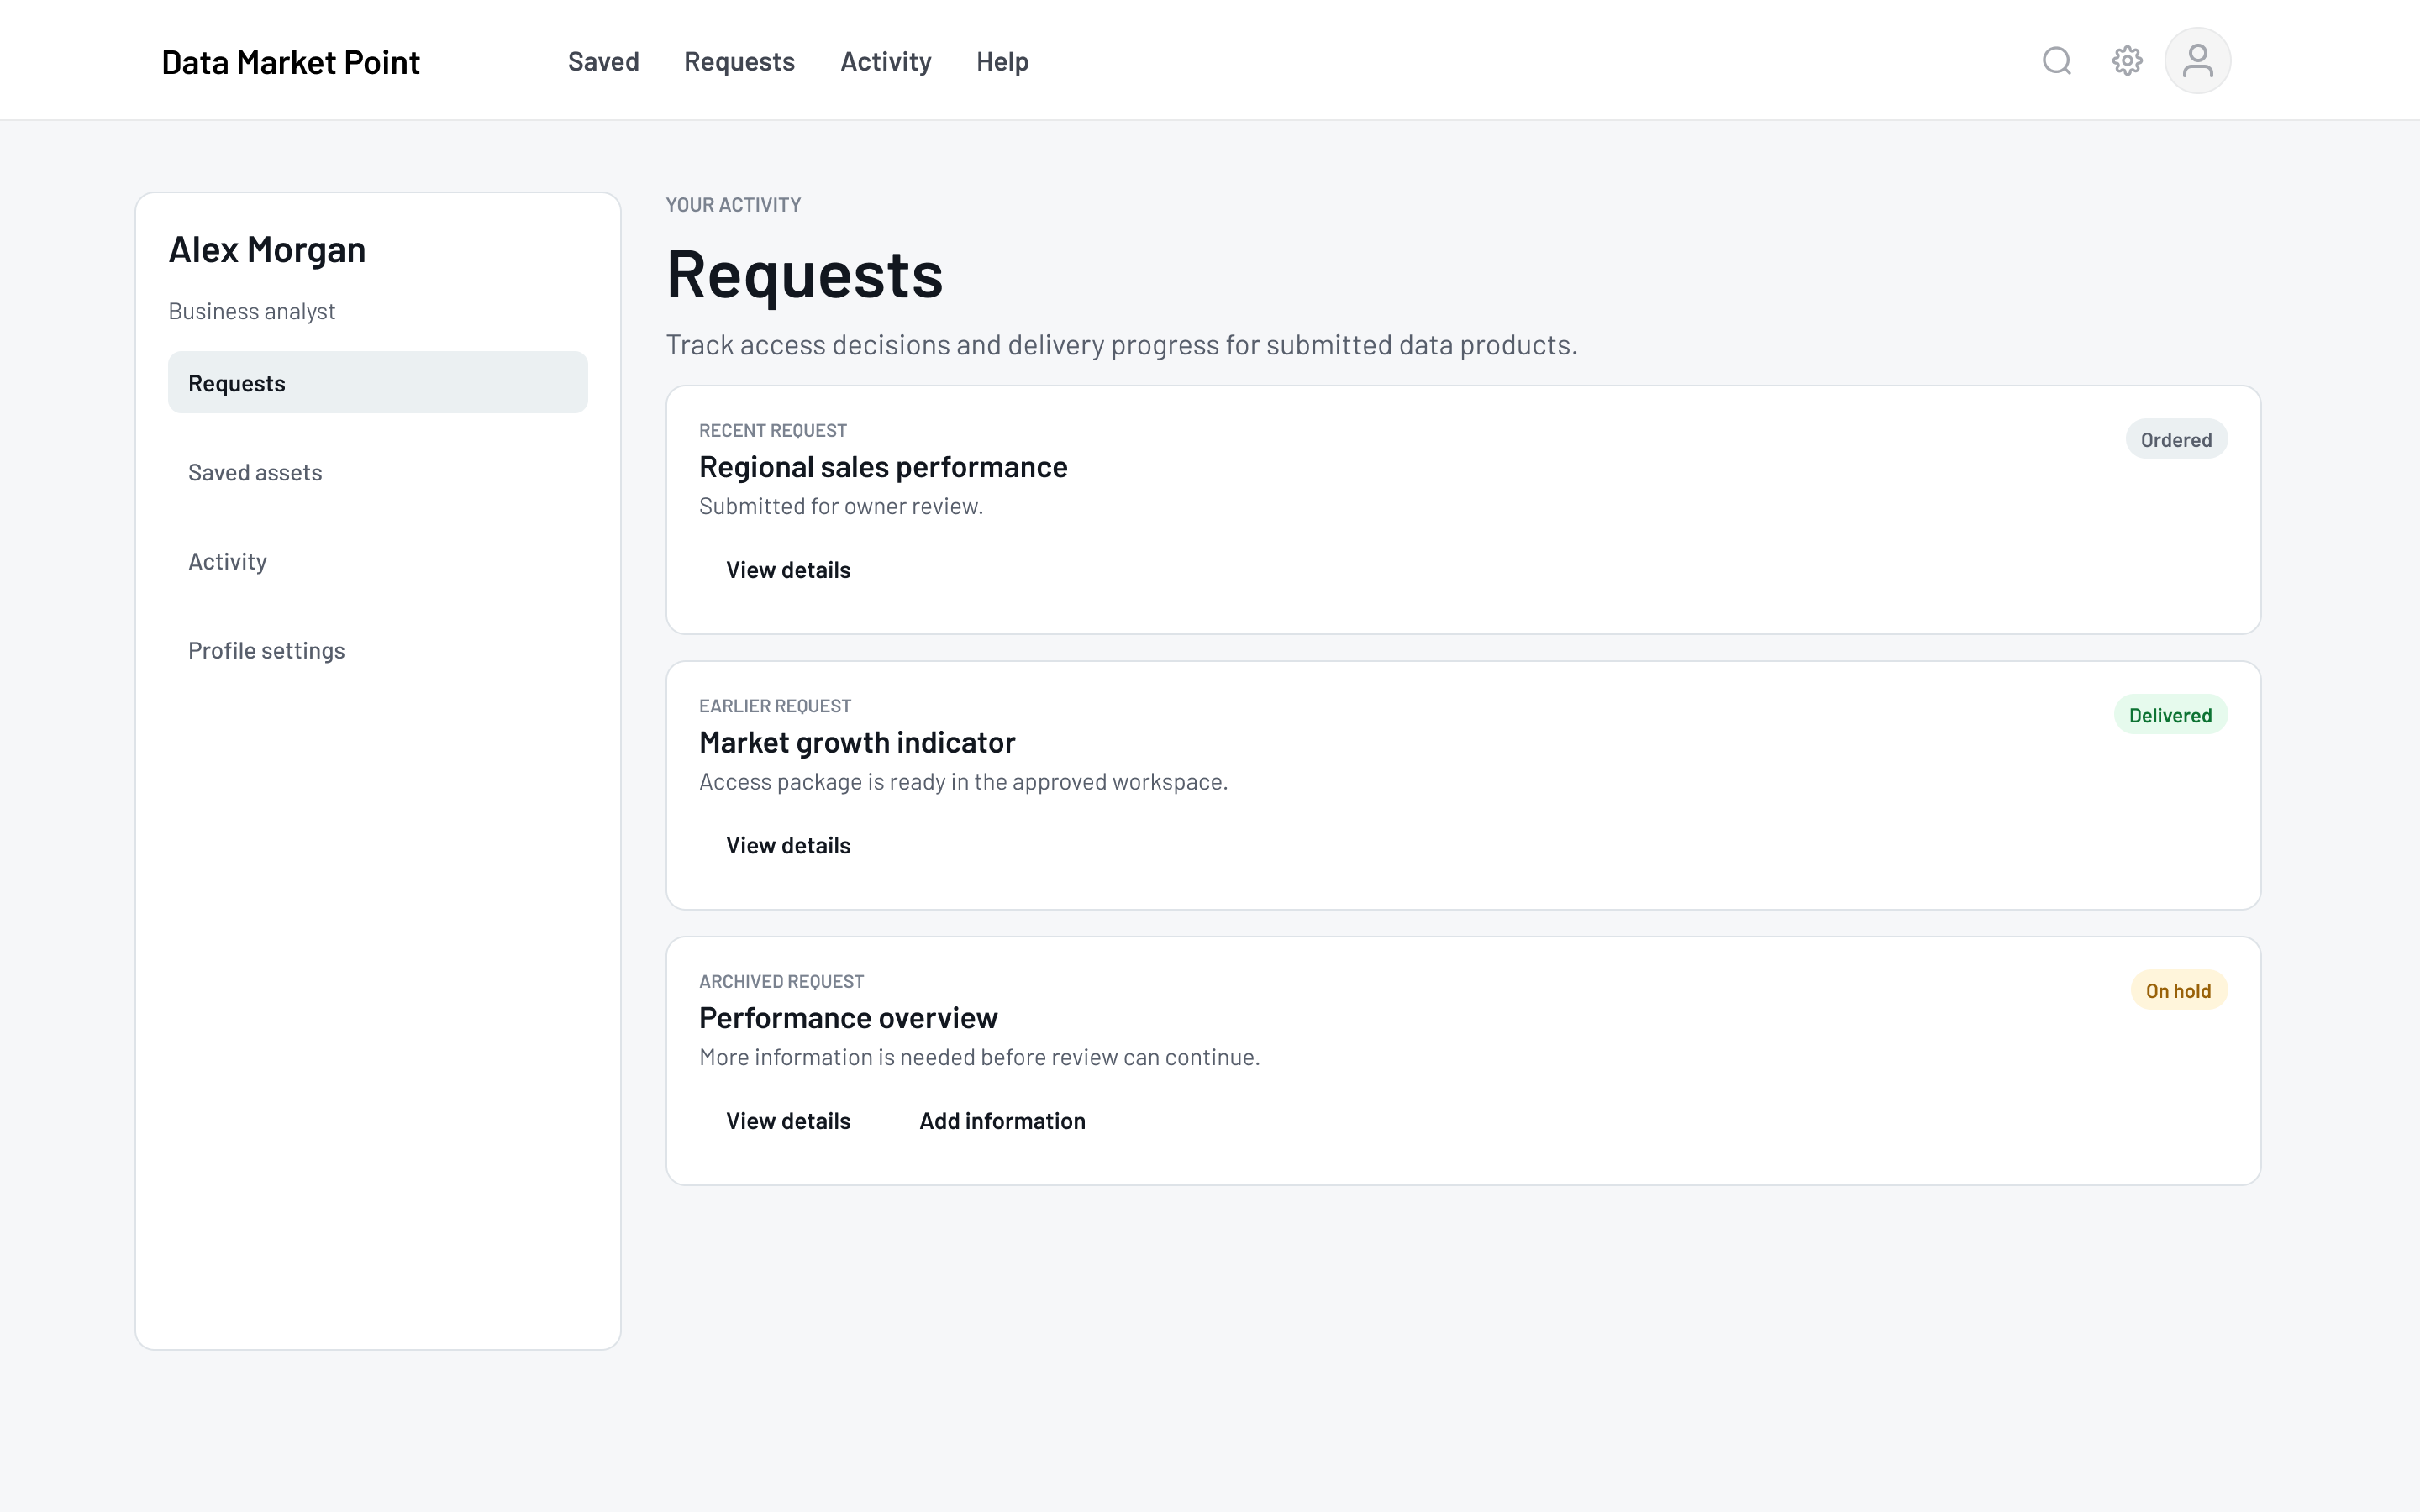
Return to one place to see delivery, rejection, hold and follow-up states.
03 · My role
End-to-end UX/UI leadership, grounded in continuous business and technical alignment.
As UX/UI Lead, I was accountable for the complete product experience and interface—from the interaction model and information architecture to detailed UI and system implementation.
Business Analyst
Owned business analysis and requirements.
2 backend · 2 frontend · 1 tester
Each specialist owned delivery and quality within their discipline.
UX/UI Design Lead
I owned the end-to-end UX and UI and aligned it across business and technical constraints.
- Frame
Product experience
I shaped the marketplace model around the realities of governed data rather than copying an e-commerce transaction flow.
- Structure
Information architecture
I designed how asset types, definitions, ownership, taxonomy and access states formed a coherent navigation model.
- Design
UX and UI
I led the complete UX and UI, including discovery, details, request, status, saved items and supporting states.
- Systemise
Design system
I implemented an early version of the organization’s internal design system in the product after contributing to that wider system for roughly six months.
- Align
Cross-functional delivery
I worked closely with the Business Analyst, two backend developers, two frontend developers and one tester. Each person remained accountable for their own specialist area.
04 · Delivery and design decisions
A three-month MVP became a globally deployed product shaped over 2.5 years.
The team moved from concept to MVP in three months. After implementation and global rollout, the product continued to evolve with new functionality informed by anonymized, general user feedback.
Across 2.5 years, close collaboration between business analysis, engineering, testing and design kept decisions connected to requirements, feasibility and real use. The design system provided a shared implementation language across screens and states.
Three months to define and deliver the first coherent end-to-end experience.
Implementation and global deployment for employees across markets.
Further capabilities were added through an ongoing feedback-informed cycle.
One search language
Common filters and result anatomy make different asset classes comparable.
Context before action
Definitions and governance details help users judge relevance before requesting.
Status after submission
The request remains part of the product experience after it leaves the basket.
05 · Product experience
Five views carry the journey from discovery to accountable access.
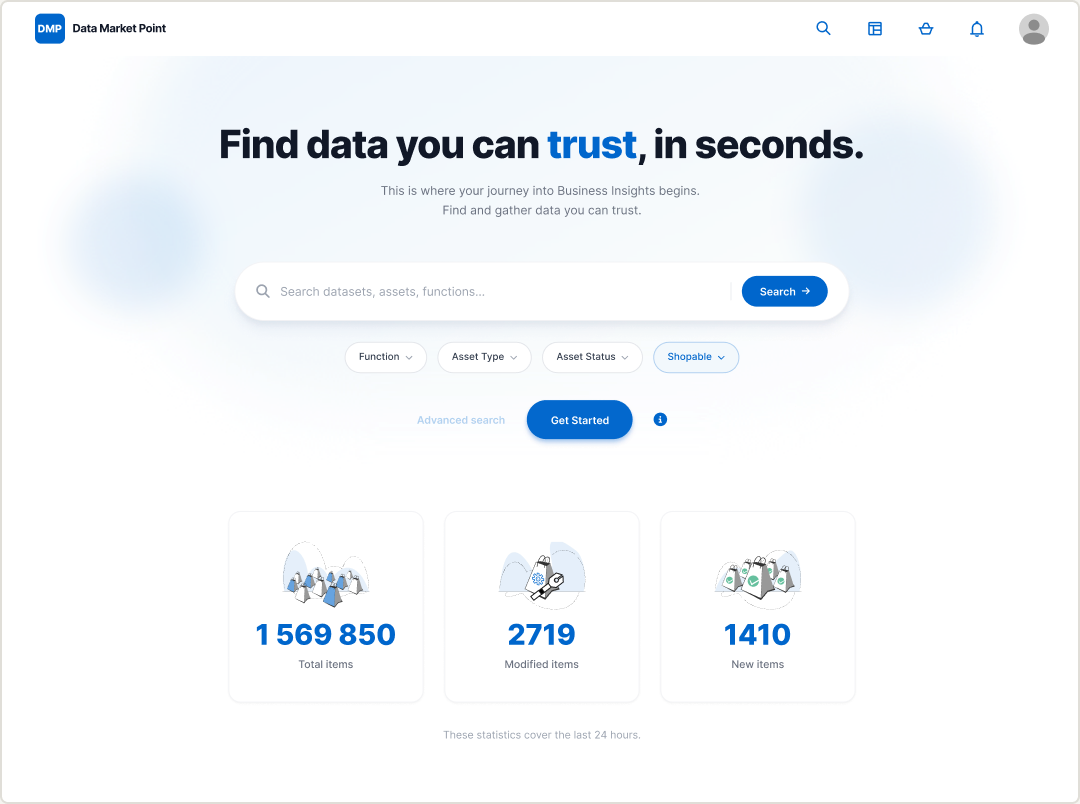
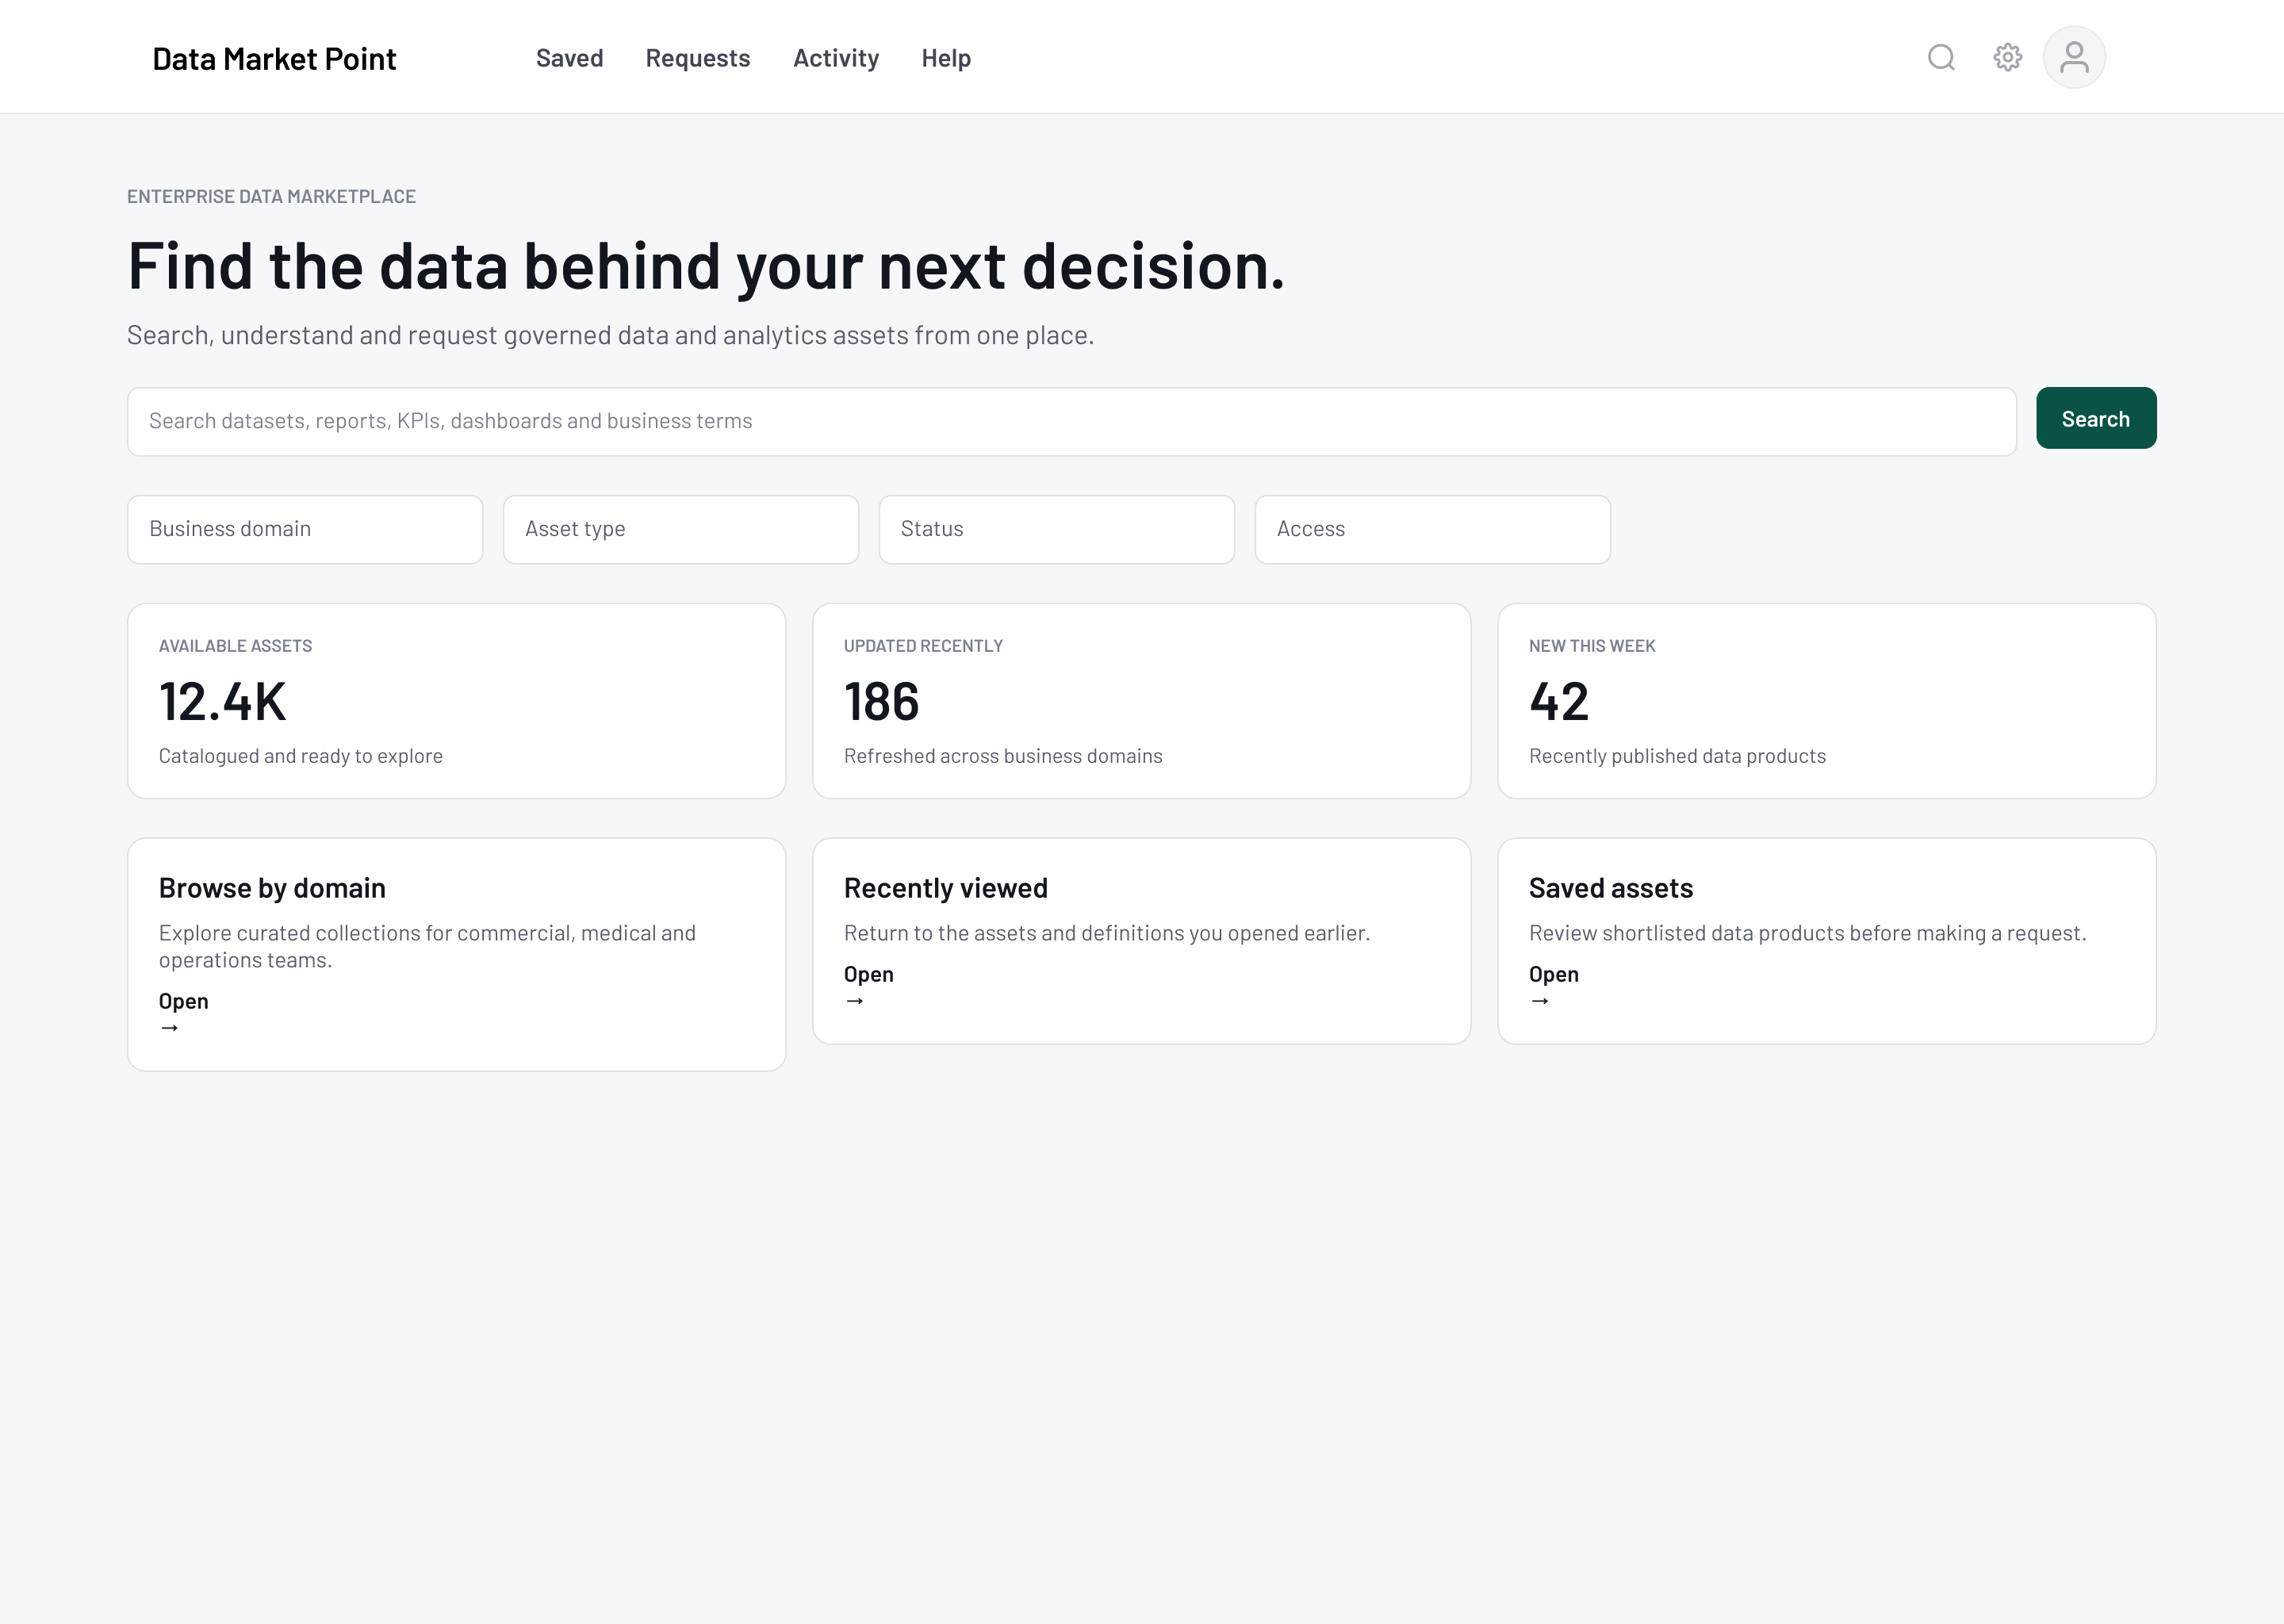
Marketplace home
Start from search, asset categories, saved discovery and recently updated content.
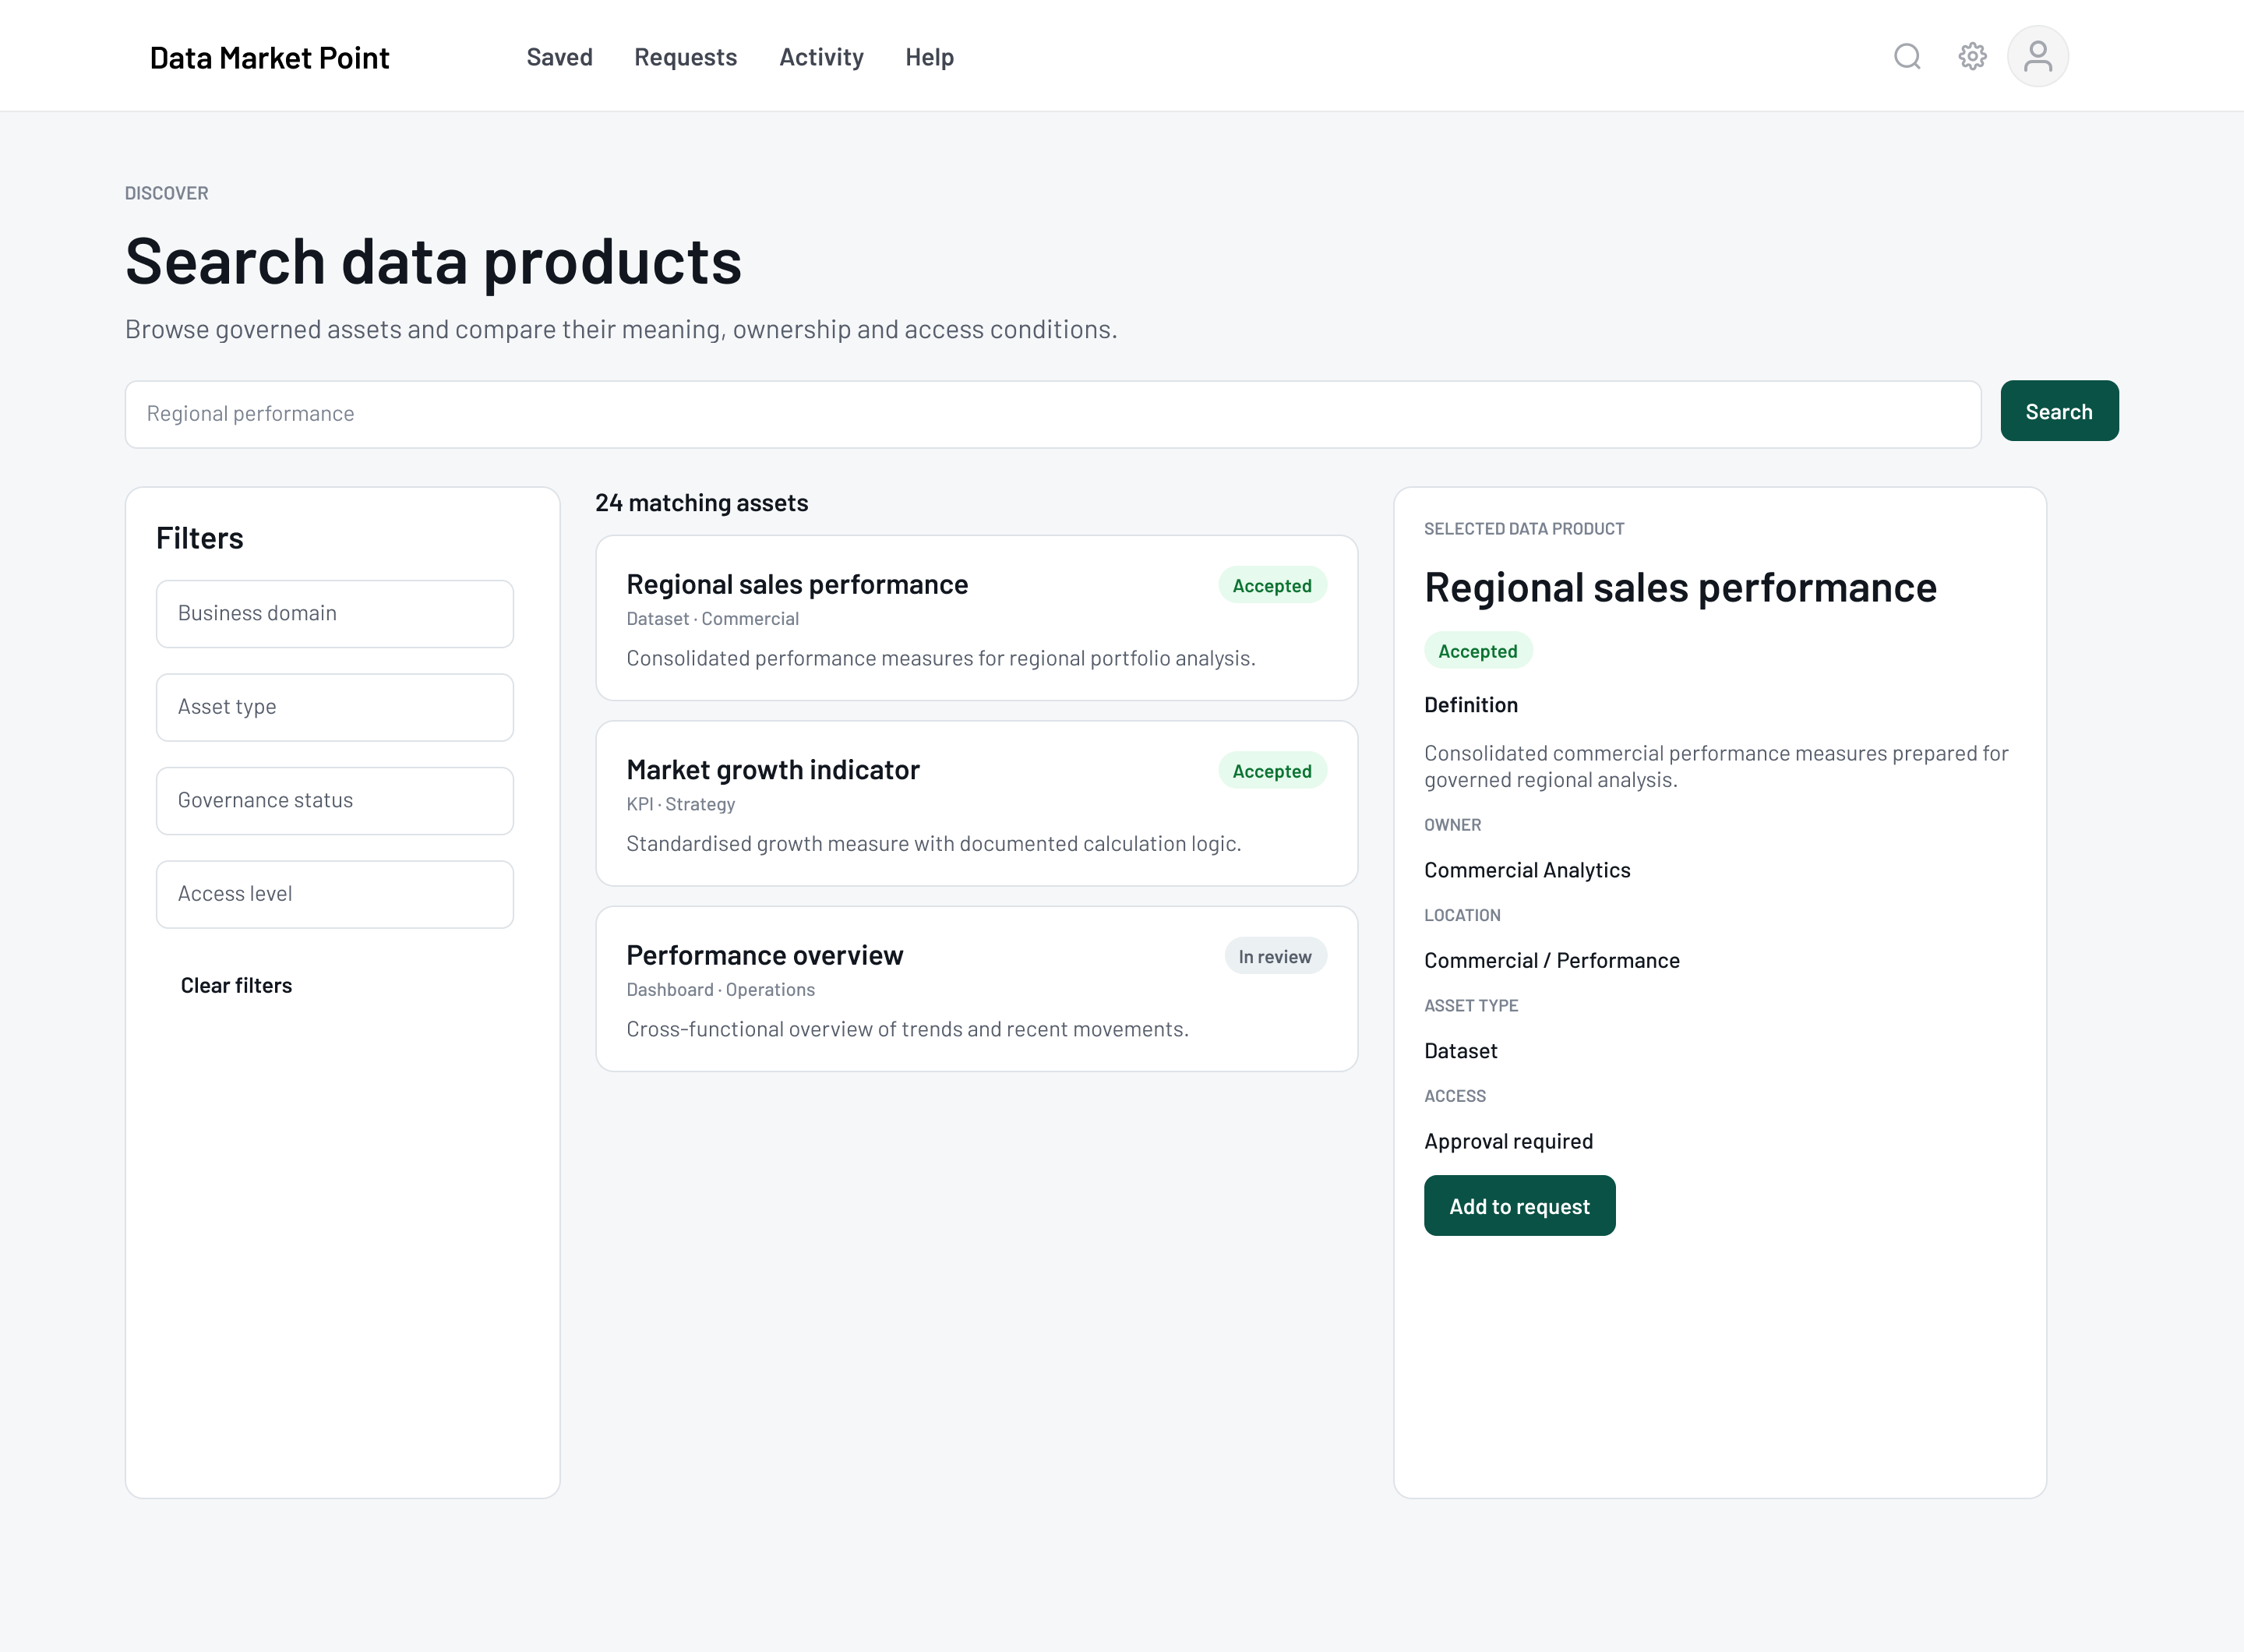
Search results
Filter across enterprise dimensions and scan consistent result summaries.
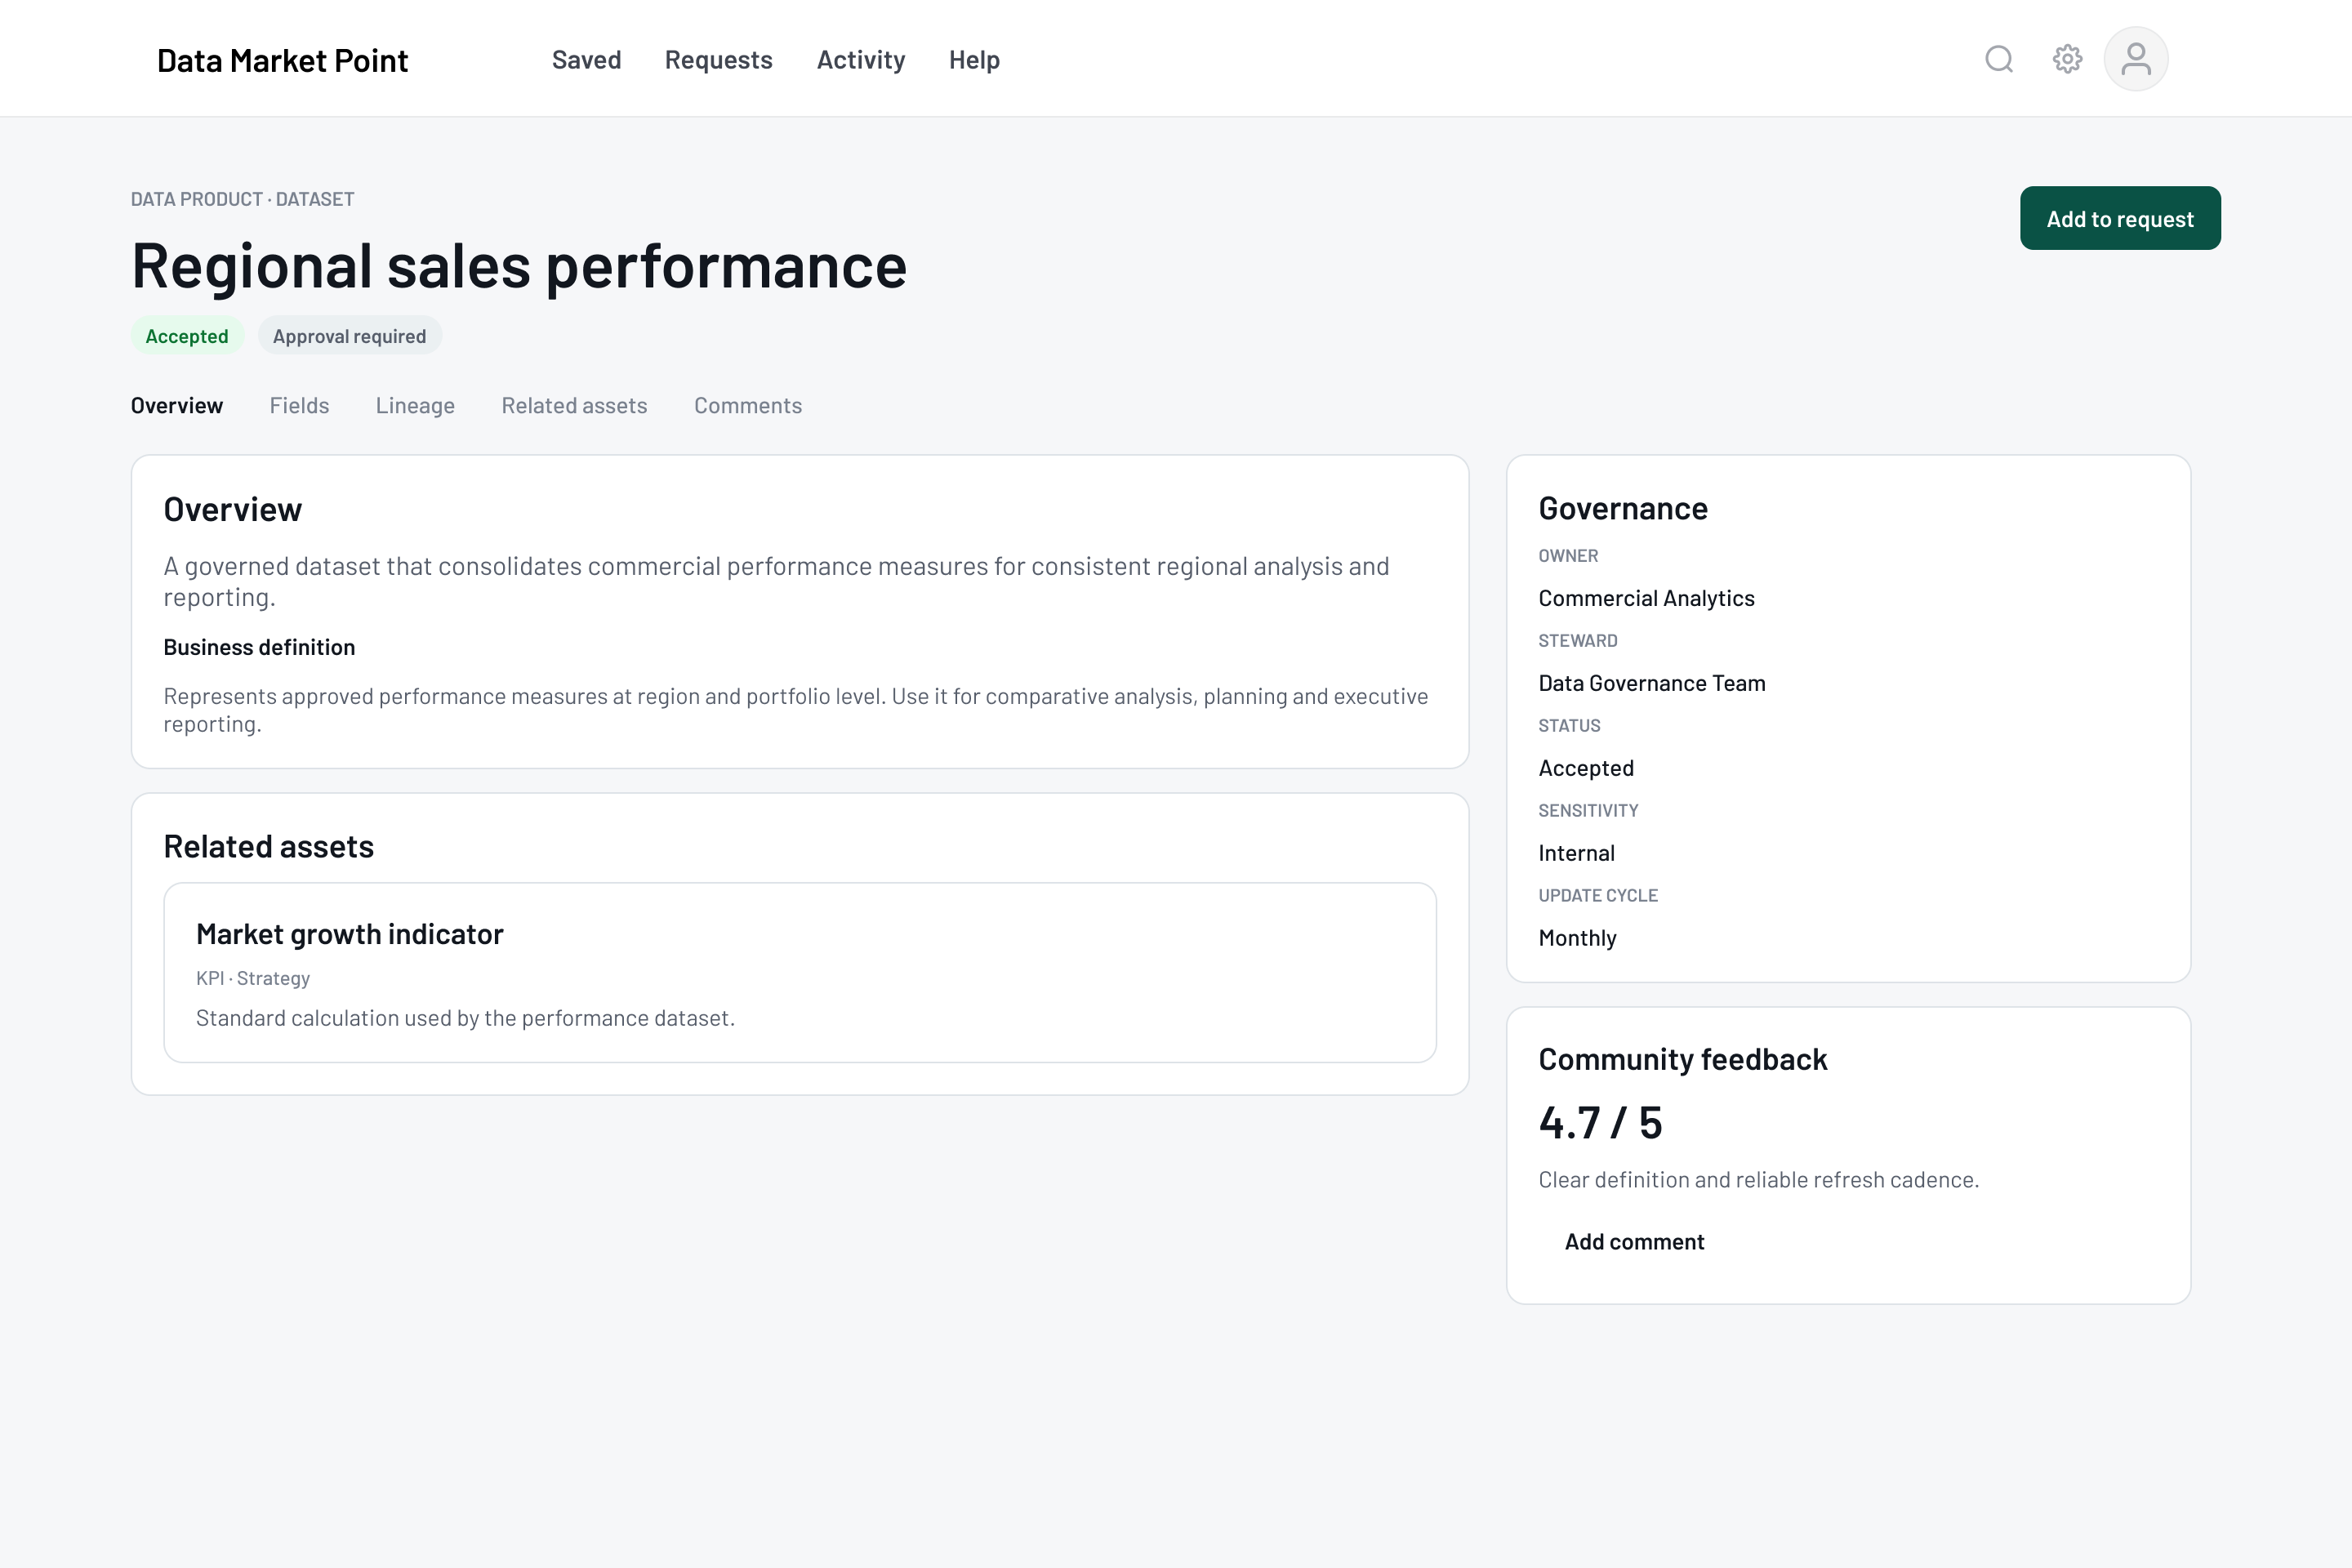
Asset details
Understand definition, ownership, status, taxonomy and relationships.
Request basket
Group relevant assets and provide a business justification in context.
Requests and status
See governance progress, decisions and items that need attention.
06 · Evidence and outcome
The platform reached a global workforce and kept evolving through user feedback.
- Global rollout
Deployed across markets
Data Market Point was implemented for employees working across the organization worldwide.
- Continued use
A shared enterprise platform
Employees around the world used one experience to discover data and navigate governed access.
- Qualitative signal
Positive feedback
General, anonymized user feedback was positive and informed continued development and new functionality.
The core design achievement was making governed access understandable—without pretending enterprise data behaves like a consumer purchase.
07 · What this demonstrates
Enterprise UX leadership across information, interaction and implementation.
Systems thinking
Translate complex data, ownership and governance relationships into a model people can navigate.
Cross-functional leadership
Keep UX/UI decisions aligned with business requirements and technical constraints through close collaboration.
Design-system practice
Use a reusable internal system to carry consistency from product direction into detailed interface delivery.